HOW DIAMOND FOOTPRINTS FOUND THEIR WAY
INTO THE KIMBERLEY PROCESS TOOLBOX


By Mark Van Bockstael
Chair, KP Working Group of Diamond Experts
Chairman, WDC Technical Committee
A fact that most members of the global diamond community are possibly unaware of is that diamond production footprints have always been an integral part of the Kimberley Process (KP). This has been the case from the very beginning.
For clarification purposes a footprint refers to distinct physical characteristics that make up the particular profile of the rough diamonds mined at a specific geographic location. They are the result of both chemical and geophysical processes that occurred naturally at the site over sometimes millions of years, affecting diamonds from the same deposits in common ways.
At the landmark first meeting of the Kimberley Process, which took place in South Africa on May 11 and 12, 2000, Andrew Coxon, a renowned diamond expert from De Beers, delivered a presentation on how representative samples from different diamond deposits from various countries – whether from primary, kimberlite deposits or secondary, alluvial or marine deposits – may be used to verify the authenticity of a stated origin. What he suggested then was, if the importing authorities and customs experts in the trade centers had access to these diamond samples for comparison, then false origins as stated on import customs declarations could be detected more easily, and contamination of the legitimate diamond pipeline be avoided.
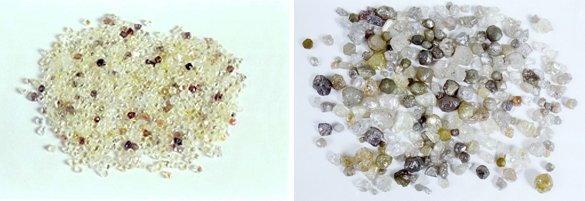
Images of representative samples from two distinct diamond deposits, as presented by De Beers at the inaugural meeting of the Kimberley Process in 2000. Such samples are also commonly referred to by diamond experts as “run of mine.” The photo on the left is a sample from the Cuango region in Angola, while the second photo is “run of mine” from Mbuyi-Mayi in the DRC.
The first “African Diamond Industry Forum,” as KP’s inaugural meeting was called, ended with conclusions and recommendations that three years later gave rise to the Kimberley Process Certification Scheme (KPCS). However, the proposal to verify origin claims using representative samples of known diamond deposits was not retained.
From representative diamond samples to footprints
When the KPCS officially was launched on January 1, 2003, its core document prescribed internal controls to be performed by the KP export authorities in diamond producing countries, but it did not even suggest, let alone advise, the use of representative production samples for comparison. Indeed, following the peaceful resolution of the conflicts in Angola, Sierra Leone and Liberia in the early years of the certification scheme, little attention was devoted to the topic.
This changed abruptly in 2006, when a report issued by a UN Panel of Experts blamed Ghana for certifying contraband conflict diamonds from Côte d’Ivoire. The 2006 KP Plenary in Gaborone reacted promptly, adopting an Administrative Decision that included an action plan. In its concluding paragraph, Ghana was urged to share detailed packing lists of rough diamond exports. This was meant to enable KP’s Working Group of Diamond Experts (WGDE) determine an objective “footprint” of the Ghanaian diamond production.
To manage the process, Ghana was requested to digitally photograph the contents of all rough diamond shipments and have them ready for inspection by a team of independent World Diamond Council (WDC) experts from November 2006 to February 2007.
The WDC consented to send to Ghana three inspection and assistance missions, for one week at a time, to advise on the origin of the rough diamond shipments presented for export. Andy Coxon agreed to be the team leader.
Just two years later, in December 2008, the WGDE produced a footprint of diamonds from the Marange region in Zimbabwe, to help the trade and importing KP countries identify rough stones from the area, and to prevent their being smuggled into the mainstream pipeline. Based on this established footprint, an Administrative Decision on Guinea was adopted by the 2009 KP Plenary, following shipments of diamonds from Guinea with characteristics that matched the Marange footprint.
Also in 2009, the UN Security Council passed Resolution 1893 focusing on Côte d’Ivoire. It tasked the KP with collecting technical information about Ivorian diamond production, and to further that purpose actually exempted imports of Ivorian diamonds from the diamond export embargo on the country. The WGDE set up a Scientific Subgroup to research fingerprinting technologies, with the goal being to identify origin by examining individual diamonds, rather than whole diamond parcels.
Since 2013, the KP has concentrated its verification efforts on securing the embargo of rough diamonds from the Central African Republic (CAR). In 2015, the KP Plenary adopted an Administrative Decision to allow the resumption of diamond exports from diamond producing zones that have become KP-compliant, and to date only a number of administrative zones in the Western production zone have been allowed to export.
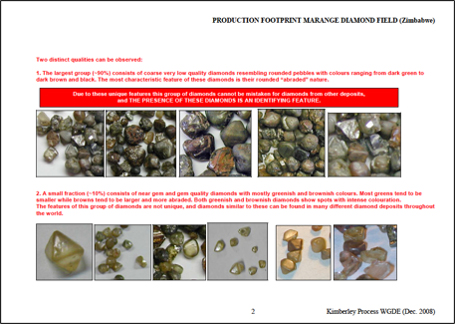
This footprint of rough diamonds from the Marange field in Zimbabwe was produced by KP’s WGDE in December 2008, when indications of massive smuggling of rough diamonds with strange characteristics were recorded in various countries.
All diamond exports from CAR are now scrutinized and compared with the established production footprint, in order to stop the contamination of legal exports with diamonds produced in Eastern CAR that are non KP-compliant.
This effort by the KP CAR Monitoring Team is ongoing, as is the work of the WGDE Diamond Experts Team (DET) that is performing the actual footprint comparison, shipment after shipment.
The do’s and don’ts of footprints
The first step in any footprint exercise is to record the three major variables – Size Frequency Distribution (SFD), Quality Frequency Distribution (QFD) and Morphology – of the diamond production at a particular mine, in the case of large-scale diamond mining (LSM), or from a particular region where alluvial diamonds are being retrieved by artisanal or small-scale miners (ASM).
This produces a production footprint, which can then be compared with the footprint of an export shipment under review, if it is large enough to be statistically relevant. A more accurate result will be obtained by aggregating the export shipments from that particular production area over a typical production period of approximately five weeks. If certain sizes and qualities are missing, such as the large and better stones, it could indicate that they have been smuggled out, probably to evade paying export taxes to the government. On the other hand, if a different than expected range of sizes and qualities are recorded, it may suggest that the production has been contaminated with rough diamonds looking for a KP certificate.
What is clear is that footprint comparison is an effective tool for detecting anomalies, both when an export shipment is exported from a producing country (a so-called first export), and when a shipment from a particular production source is transshipped through a KP-member country without altering the content. But, once rough diamond parcels have been quality-sorted in trading hubs, and aggregated with diamonds of equal quality and size from different sources, footprint comparisons are no longer possible.
If you have any questions or comments following this article, you are welcome to send them to info@worlddiamondcouncil.org.
The three key variables
of a rough diamond footprint
What is referred to as the diamond footprint is the statistical projection of the characteristics of a representative sample of the diamond production from a particular diamond mine or diamond production region. As such it is the statistical representation of the run of mine.
To accurately describe the characteristics of any diamond production, three major variables are recorded: the Size Frequency Distribution (SFD) or granulometry, the Quality Frequency Distribution (QFD) and the Morphology of the diamond crystals from that sample.
Much of the science behind the use of rough diamond footprints as an indicator of origin dates back to the pioneering work done in the 1970s and 1980s by scientists such as Jeffrey Harris from De Beers and Yuri Orlov from the then-Soviet Union.
Size Frequency Distribution (SFD)
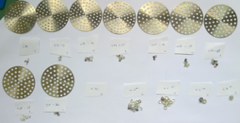
SFD is obtained by sieving and weighing all the diamonds in a run-of-mine parcel. Mining companies mostly prefer the use of DTC-type sieves, while the trade uses commercial sieves that can also be used to sieve polished (round) diamonds.
Quality Frequency Distribution (SFD)
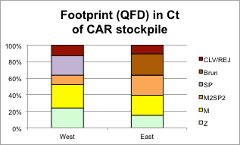
QFD requires sorting by experienced rough diamond sorters. After weighing the stones organized according to different sorting categories, the proportional makeup of the run of mine is recorded.
Crystal Morphology
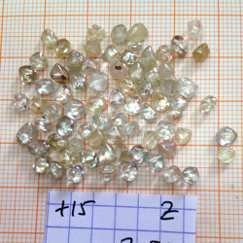
Crystal Morphology relates to the classification of particular features of the rough diamonds, such as whether cubes or octahedrons or dodecs (dodecahedrons) are more prevalent in any particular deposit. If the physical parcel is not directly available, than sets of calibrated (high resolution) digital pictures are used as substitutes.


